


What does the LGC say about Peak Prices?
For the Trader/ Investor and the Hodler

Dear Readers,

With price pushing all time highs, and a fair chance of prices going parabolic at some point, many have their minds on what peak prices might actually eventuate. And rightly so if the Bitcoin investor is looking to take some profits in the not-too-distant future. Of course, if the investor considers themselves more of a longer-term hodler this hardly applies, though they still may want to skim a little profit. I’ll first look at the daily chart, and then zoom out to sketch those potential peaks… as based in most part on the LGC [logarithmic growth curve] model that has performed since 2018.
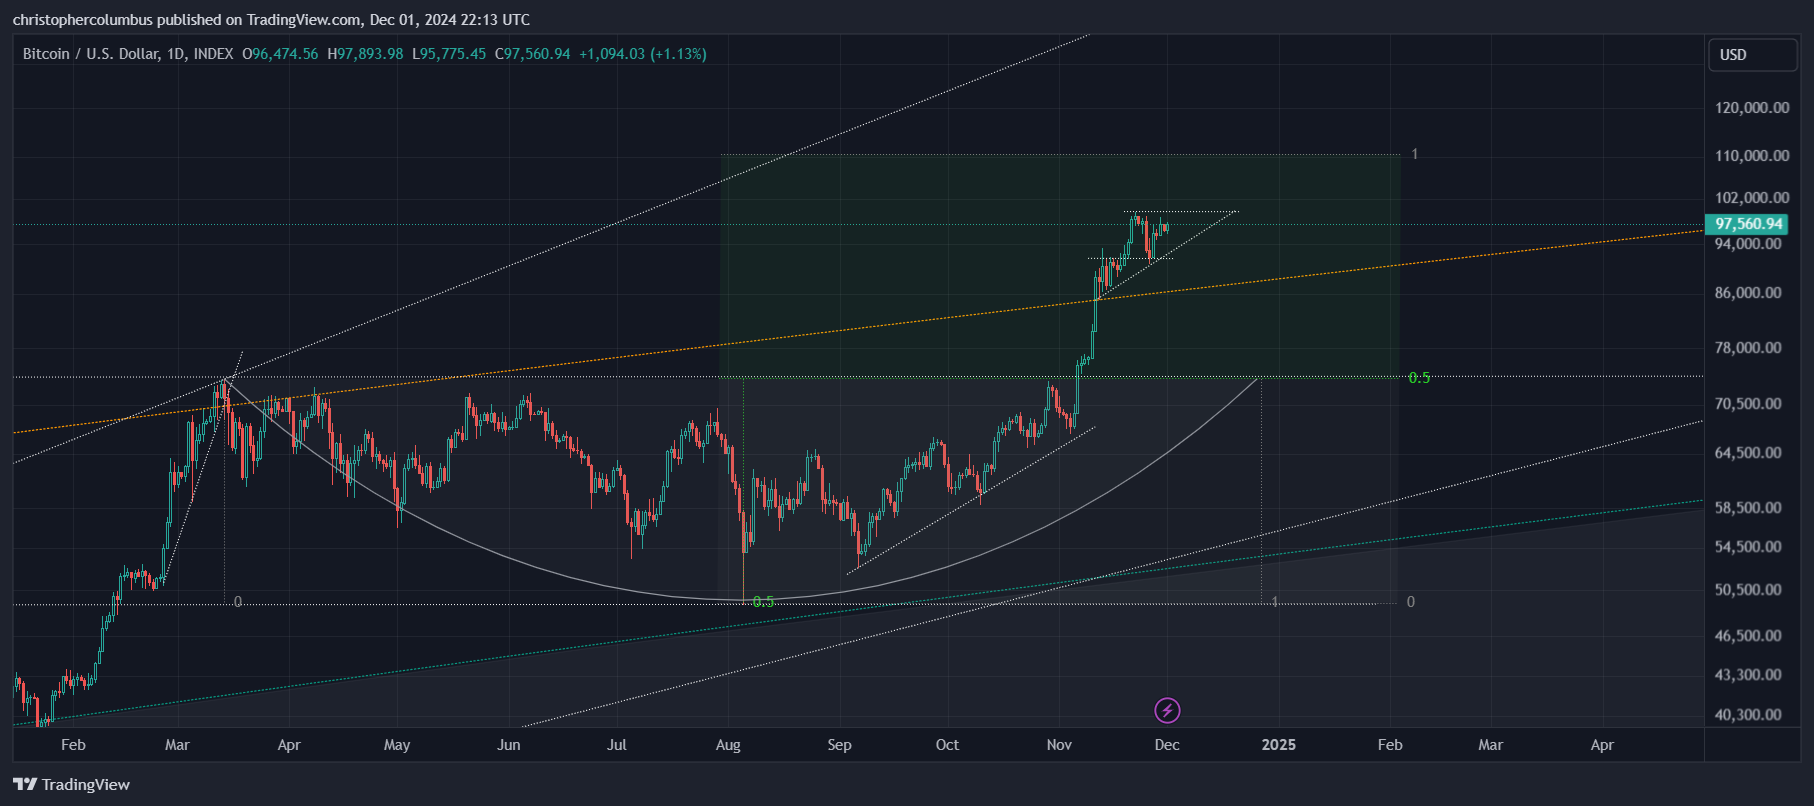
The current chart is still within a solid technical set-up with a shorter-term target of 110K. In the more immediate term we see an ascending triangle forming, where price increasingly comes to test the previous high - a good sign. Also of psychological significance here is the potential break of that five figure barrier. If/ once price pushes through 100K, we could very well see that parabolic move that itself breaks out of the technicals.
The question then is how long does this parabolic move last, and how high could it go. In my opinion, all we can really do in the attempt to divine the future is to rely on a model that has previously performed. Though it can in no way be considered clairvoyance, it does give us something to ‘hang our hats on’. And though it can never arrive at an exact number, it could perhaps give us a region in which it would be reasonable to think the parabolic move might peak. And so to the LGC.
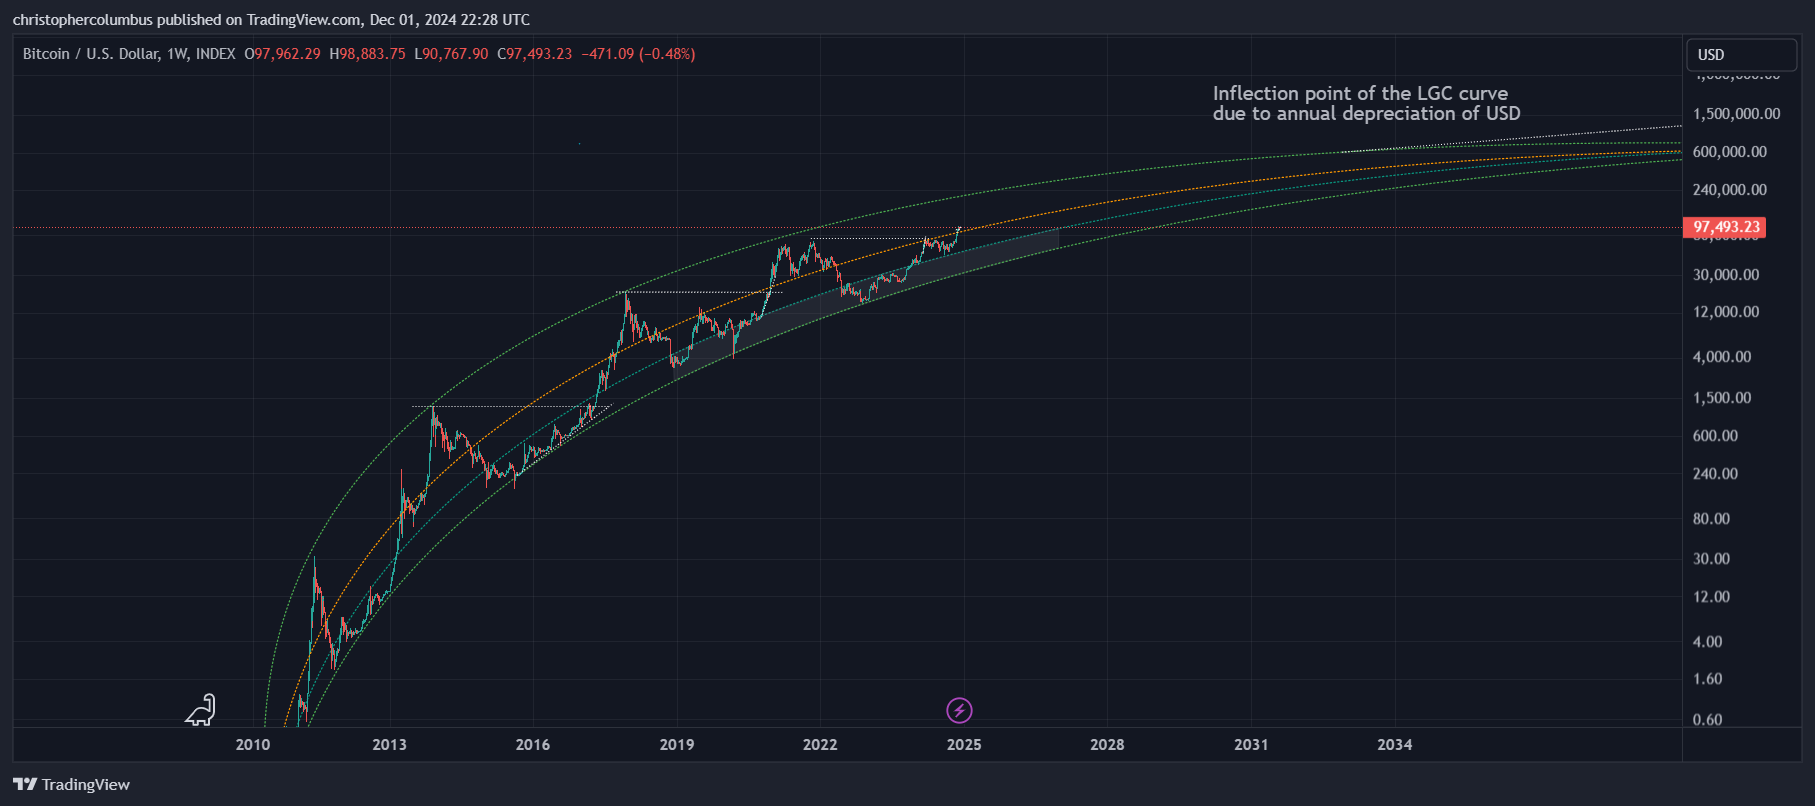
First of, zoomed right out, a converging and plateauing channel representing a logarithmic growth curve, a well-known force of nature. The macro theory here is why should the relatively rapid capitalization of BTC in a free market - made of many participants battling it out in something akin to a state of nature - not represent a log growth curve. And indeed, when a log growth curve is overlaid onto the whole history of Bitcoin’s price action, one does see it has in fact developed so far in those terms. The theory accordingly extrapolates that into the future.
The scientific nature of the theory lies in both its explanatory and predictive power. It needs to provide predictions, and needs to be tested by subsequent events, whereby those predictions could potentially be either invalidated or confirmed. Any objective observer can not doubt that with price movement having been contained within that relatively narrow [and narrowing] channel, this model has been well corroborated/ strengthened.
Neither is there need to ‘re-fit’ or tweak the channel as that would be meddling with the model [of an LGC], which has performed very well since 2018. That price briefly dipped below in 2015 and 2020, and did not quite reach the top in 2021, is irrelevant from a model’s perspective - all models allow for tolerances. The channel should be considered a region within which a volatile price is expected to develop.
Now to zoom in in order to consider peak prices this time round should the market go manic here.
For access to full article and archive to previous articles, make sure to subscribe now.